3. Calculating Upper Control Limit (UCL)
Upper Control Limit is calculated by the formula:

p-Bar: Average product non-conformities
n: The amount of production per group
4. Calculating Lower Control Limit (LCL)
Lower Control Limit is calculated by the formula:

p-Bar: Average product non-conformities
n: The amount of production per group
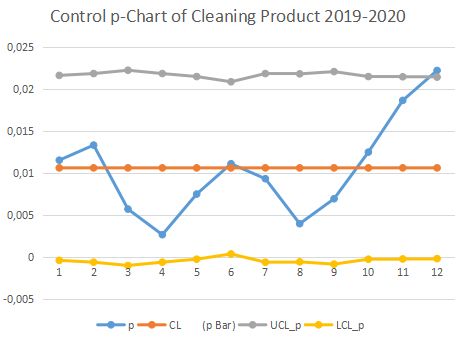
Based on production data for 1 year (November 2019 - October 2020), the calculation of the upper control limit, lower control limit, and center line is made in 1 Control p-Chart. The main data in this study are monthly notes which are used as samples for observation and for products that are damaged (defective). Control p-Chart shows changes in data over time, with the inclusion of maximum and minimum limits which are the boundaries of the control area.


