


ABSTRACT:
Production result in a business is really important factor in a business. Sometimes, a product that is manufactured has defects and does not comply with the standard. So that production results must always be monitored so that product defects are not out of control. In the Lean Six Sigma concept, a product must not have defects of more than 3,4. The method used in Lean Six Sigma is DMAIC. One of the phases in this method is Analyze. The Analyze phase is very important for determining the average level of quality, knowing changes that have occurred in the average value, and evaluating the quality performance. The tools that we will use in Phase Analysis in the discussion are p-Chart. Because the business owner received several complaints in early 2020 against the results of the home industry cleaning products in Labuhan Batu Utara district. Therefore, efforts made to monitor production results can use Statistic Quality Control (SQC) to determine the tolerance limit for product defects and business owners can minimize defects in production results.
Keywords: Six Sigma, DMAIC, Control p-Chart, Home Industry, Production
BACKGROUND
Home Industry is an Micro Small Medium and Entreprises (MSME) and a family business where the workers are members of the family itself. Home Industry which is the object to be studied carries out the production process at home. The production process is carried out 50% in a closed room and 50% in an open space. This is because the production location for the home industry is still very flexible. A business cannot escape product damage to production results. Likewise, an MSME that produces cleaning products in North Labuhan Batu Regency has had some significant complaints in the last few months. In the previous year, in 2019, business owners rarely received complaints from customers. However, since August 2020, business owners have started to receive various complaints regarding product damage. Business owners have tried to remind employees of defective products so they can improve their performance. However, in the following month, the complaints received were increasing. Therefore, efforts made by business owners are to control quality using Statistical Quality Control. That way, the business owner can determine the level of product damage that is acceptable to the company and determine the tolerance limit for the resulting product defects.
The statistical tool used as a tool to control the quality of cleaning products is the Control p-Chart. Quality control with statistical tools is also useful for monitoring efficiency levels. So it can be used to reject and accept various products. The purpose of this study was to determine the tolerance limit of product defects produced in the home industry of cleaning products in North Labuhan Batu Regency.
PROBLEM FORMULATION
The formulation of the problem in this study is What is the level of product damage to the production of Home Industry cleaning products in North Labuhan Batu Regency using the Six Sigma Analyze Phase method?
METHODOLOGY
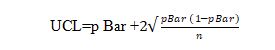
In Six Sigma we know about DMAIC method, on of the phase is Analysis. So now, we will analyze this business with Statistic Quality Control (SQC). In analysis phase, we use tools named Control p-Chart. The control p-chart functions to see whether the quality control in the company is under control or not. The control p-chart has benefit to help control of the quality of production and can provide information about when and where the company should make quality improvements. The control p-Chart is made in the following steps:
1. Calculating the Percentage of Non-Conformities